The votes have been tallied, and the results are in. See how your friends and neighbors voted for president, on legalizing marijuana and other state ballot questions.
While Donald Trump claimed victory in the race for President, Hillary Clinton took top rung in Watertown with 71 percent of the vote. Her best precinct was Precinct 10, on the Westside, where she got 1,366 votes. The 10th precinct was also Trump’s best, with 496. In terms of proportion of the vote, Clinton’s top showing was Precinct 4, where she got 78 percent, and Trump’s biggest proportion was in Precinct 11, where he got 28 percent
| Clinton | Trump | Johnson | Stein | |
| Precinct 1 | 858 | 292 | 27 | 25 |
| Precinct 2 | 1041 | 304 | 46 | 29 |
| Precinct 3 | 1193 | 291 | 50 | 33 |
| Precinct 4 | 1309 | 263 | 52 | 21 |
| Precinct 5 | 1044 | 263 | 42 | 31 |
| Precinct 6 | 1029 | 293 | 50 | 28 |
| Precinct 7 | 1132 | 371 | 56 | 24 |
| Precinct 8 | 1149 | 376 | 62 | 25 |
| Precinct 9 | 977 | 268 | 57 | 25 |
| Precinct 10 | 1366 | 496 | 73 | 36 |
| Precinct 11 | 920 | 401 | 50 | 18 |
| Precinct 12 | 924 | 303 | 60 | 25 |
| TOTAL | 12942 | 3921 | 625 | 320 |
Question 1, which asked to add another slot machine parlor license in Massachusetts, lost in Watertown (with 70 percent opposing) and statewide. The best precinct for “Yes” came in Precinct 10 where it got nearly 40 percent of the vote, and “No” got the best result in were in Precinct 4 where it got 77 percent of the vote.
| Yes on 1 | No on 1 | |
| Precinct 1 | 336 | 800 |
| Precinct 2 | 419 | 974 |
| Precinct 3 | 425 | 1126 |
| Precinct 4 | 377 | 1253 |
| Precinct 5 | 373 | 983 |
| Precinct 6 | 392 | 980 |
| Precinct 7 | 438 | 1151 |
| Precinct 8 | 480 | 1094 |
| Precinct 9 | 400 | 891 |
| Precinct 10 | 665 | 1284 |
| Precinct 11 | 531 | 815 |
| Precinct 12 | 422 | 886 |
| TOTAL | 5258 | 12237 |
The charter school ballot question lost in Massachusetts, and again Watertown mirrored the result with 68 percent of voters voting “No.” Precinct 9 had the biggest percentage of “Yes” votes, with 36 percent. Several precincts had around 70 percent of their votes go to “No” on Question 2 – 2, 3, 8 and 10.
| Yes on 2 | No on 2 | |
| Precinct 1 | 412 | 762 |
| Precinct 2 | 428 | 979 |
| Precinct 3 | 484 | 1097 |
| Precinct 4 | 574 | 1081 |
| Precinct 5 | 461 | 911 |
| Precinct 6 | 467 | 925 |
| Precinct 7 | 504 | 1110 |
| Precinct 8 | 488 | 1125 |
| Precinct 9 | 486 | 845 |
| Precinct 10 | 608 | 1375 |
| Precinct 11 | 433 | 958 |
| Precinct 12 | 412 | 920 |
| TOTAL | 5757 | 12088 |
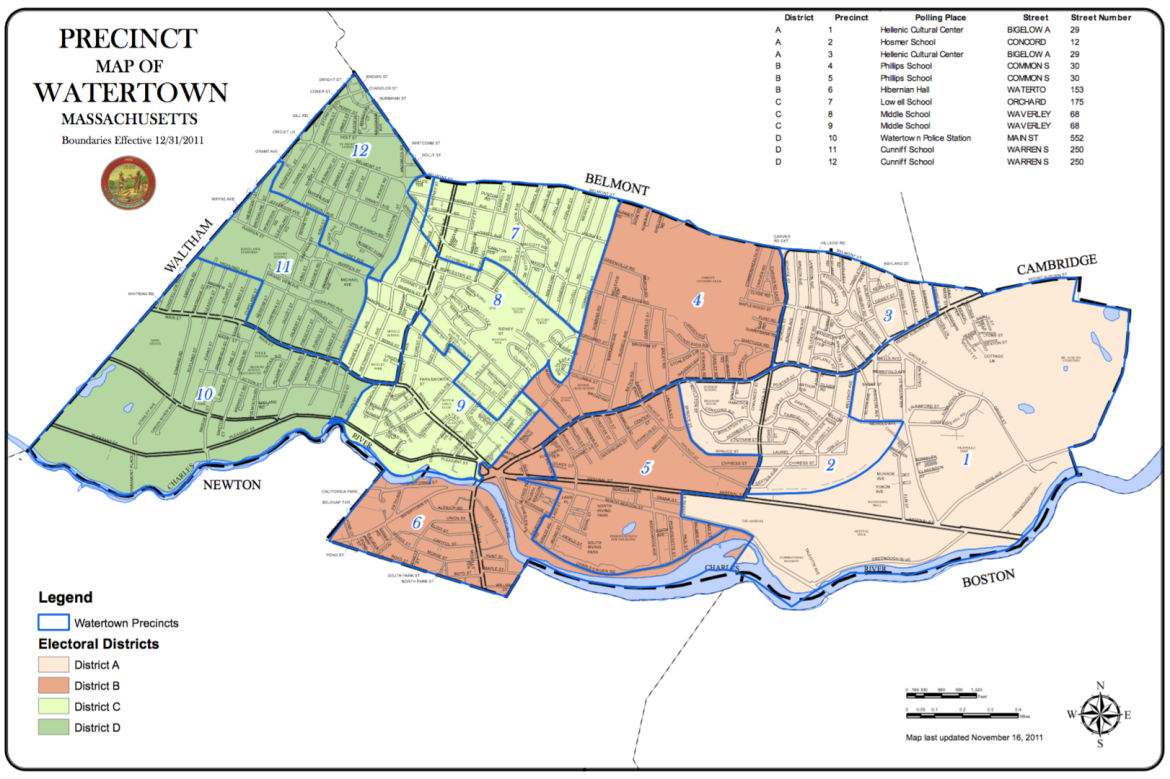
Town of Watertown
A map of Watertown’s Districts: Peach is A, Red is B, Lime Green is C, Green is D.
Watertown voters strongly backed Question 3 (82 percent), which prevents livestock from being kept in confined spaces. It also won statewide. The best precincts for the “Yes” campaign were 4 and 5, which were both around 85 percent. The best percentage for “No” on 3 was in Precinct 12, where it garnered 21 percent of the votes.
| Yes on 3 | No on 3 | |
| Precinct 1 | 933 | 237 |
| Precinct 2 | 1176 | 236 |
| Precinct 3 | 1329 | 260 |
| Precinct 4 | 1414 | 250 |
| Precinct 5 | 1168 | 215 |
| Precinct 6 | 1130 | 266 |
| Precinct 7 | 1325 | 294 |
| Precinct 8 | 1338 | 280 |
| Precinct 9 | 1090 | 233 |
| Precinct 10 | 1576 | 413 |
| Precinct 11 | 1124 | 269 |
| Precinct 12 | 1047 | 280 |
| TOTAL | 14650 | 3233 |
The ballot question on legalizing recreational use of marijuana gained approval in Massachusetts, and Watertown voters favored it, too, with 60 percent backing it. The biggest “Yes” precinct was 5, where 65 percent of voters backed Question 4. Precinct 11 most strongly opposed it with 45 percent voting “No.”
| Yes on 4 | No on 4 | |
| Precinct 1 | 698 | 486 |
| Precinct 2 | 890 | 528 |
| Precinct 3 | 1025 | 561 |
| Precinct 4 | 1053 | 611 |
| Precinct 5 | 908 | 482 |
| Precinct 6 | 842 | 561 |
| Precinct 7 | 951 | 675 |
| Precinct 8 | 987 | 645 |
| Precinct 9 | 824 | 507 |
| Precinct 10 | 1143 | 855 |
| Precinct 11 | 771 | 632 |
| Precinct 12 | 758 | 586 |
| TOTAL | 10850 | 7129 |
See the precinct by precinct voting on Question 5, the Community Preservation Act, and reaction from the victors by clicking here.